Monitoring
With NeuroomNet you can make your building control simple and clear.
Media technology plays an important role in many modern buildings. It is used for entertainment, information, and communication and thus contributes significantly to user comfort. To maintain this user comfort and at the same time avoid malfunctions and failures, reliable monitoring of the media technology is essential.
A monitoring system makes it possible to monitor the media technology in real-time and to react quickly to any problems if necessary. This not only avoids inconvenience for users but also financial losses due to breakdowns or repairs.
In addition, a monitoring system also offers the possibility of optimizing media technology and analyzing user behavior. This makes it possible to adapt the media technology specifically to the needs of the users and thus makes it even more satisfactory.

Overall, the monitoring of media technology in buildings offers numerous advantages: It improves user comfort, prevents failures and malfunctions, and enables targeted optimization of media technology. All this helps to make the building a modern and attractive place.
Therefore, monitoring is a very central module in NeuroomNet.
Below you can learn how the monitoring is designed in NeuroomNet.
You would like to use NeuroomNet Monitoring for your building?
Monitoring of components in the network
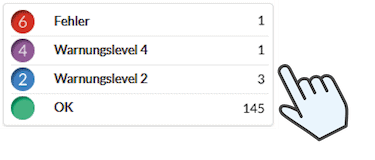
Thanks to the status summary, you can see at a glance which components are turned on.
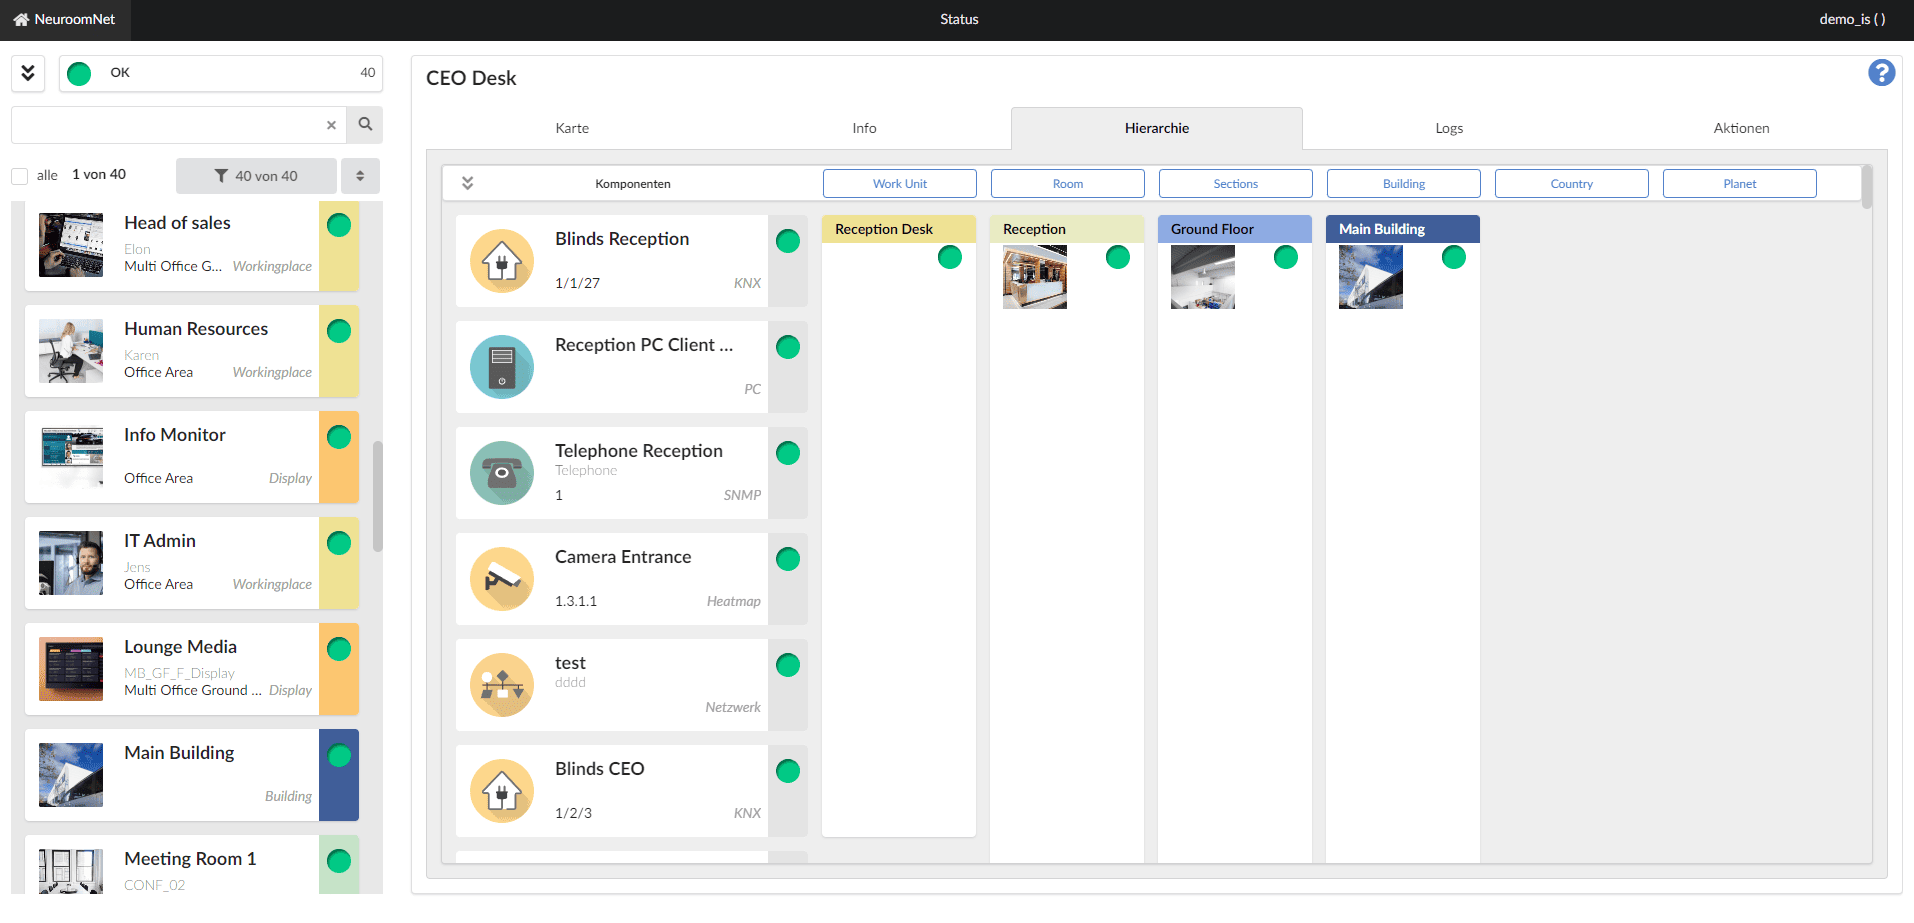
For a better overview, it is possible to group devices.
The stations are positioned as markers on the floor plans and take on the color of their status level. So you can see not only what condition the devices are in, but also where each device is located.
The technical information, instructions, documentation, etc. for groups can be conveniently displayed via the Info tab. Not only texts but also files such as images and PDFs can be stored there.
Switching devices and groups from monitoring allows a quick response when an error status occurs. However, only the people to whom you have assigned the corresponding rights can do that.
Quick overview through individual status display

Quick orientation via building plans
Automatic failure treatment
What should happen in the event of a device failure?
Should a notification be sent by email?
Should an automatic restart be performed?
Should the failure be visualized in a dashboard?
Should an announcement be made?
Or, or, or…
All no problem for NeuroomNet!
All measures can also be carried out simultaneously or in chronological order.
Of course, the failure is also logged.
Grouping for effective work
Components can be grouped logically. For example, components can be grouped into workstations, stations, or exhibits. The designations are freely selectable.
Groups can then be further grouped into any nesting depth, for example, rooms, floors, and halls. This not only serves the purpose of clarity but also simplifies many processes. “Switch off 432 components” becomes “Switch off hall 01”.
Extensive recording of status changes
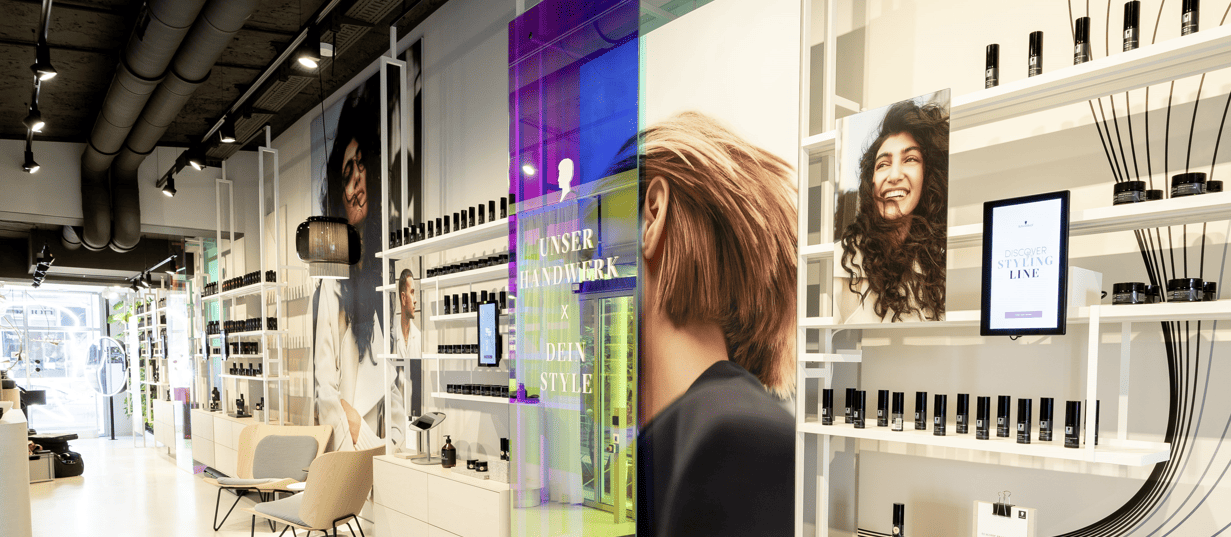
House of Schwarzkopf
In monitoring, you often want to track whether there are specific events that led to a failure.
Logging helps to identify a systematic behind system changes, e.g. if a component fails every day at the same time or always after a certain number of operating hours.
Furthermore, statistical statements can be made about technical components that may be of interest in the case of a new acquisition. Since logging data can quickly become extensive, numerous filter options are available for evaluation.
For more examples and explanations take a look at our documentation.


