


Dashboards
With NeuroomNet you can make your building control simple and clear.
Individual User Interfaces — Dashboard
Dashboards allow you to create graphical user interfaces that can be used to execute predefined actions or display specific real-time statuses or metrics.
There are many ways to style these dashboards visually. The Dashboard Designer provides ready-made templates that you can recolor and label. In the visual editor, you can position and group all elements however you like. For advanced users, styling via CSS is also possible!
Of course, only after you have set authentication and authorization! You can even granularly link individual pages and elements with rights so that only authorized rights roles are allowed to operate them.
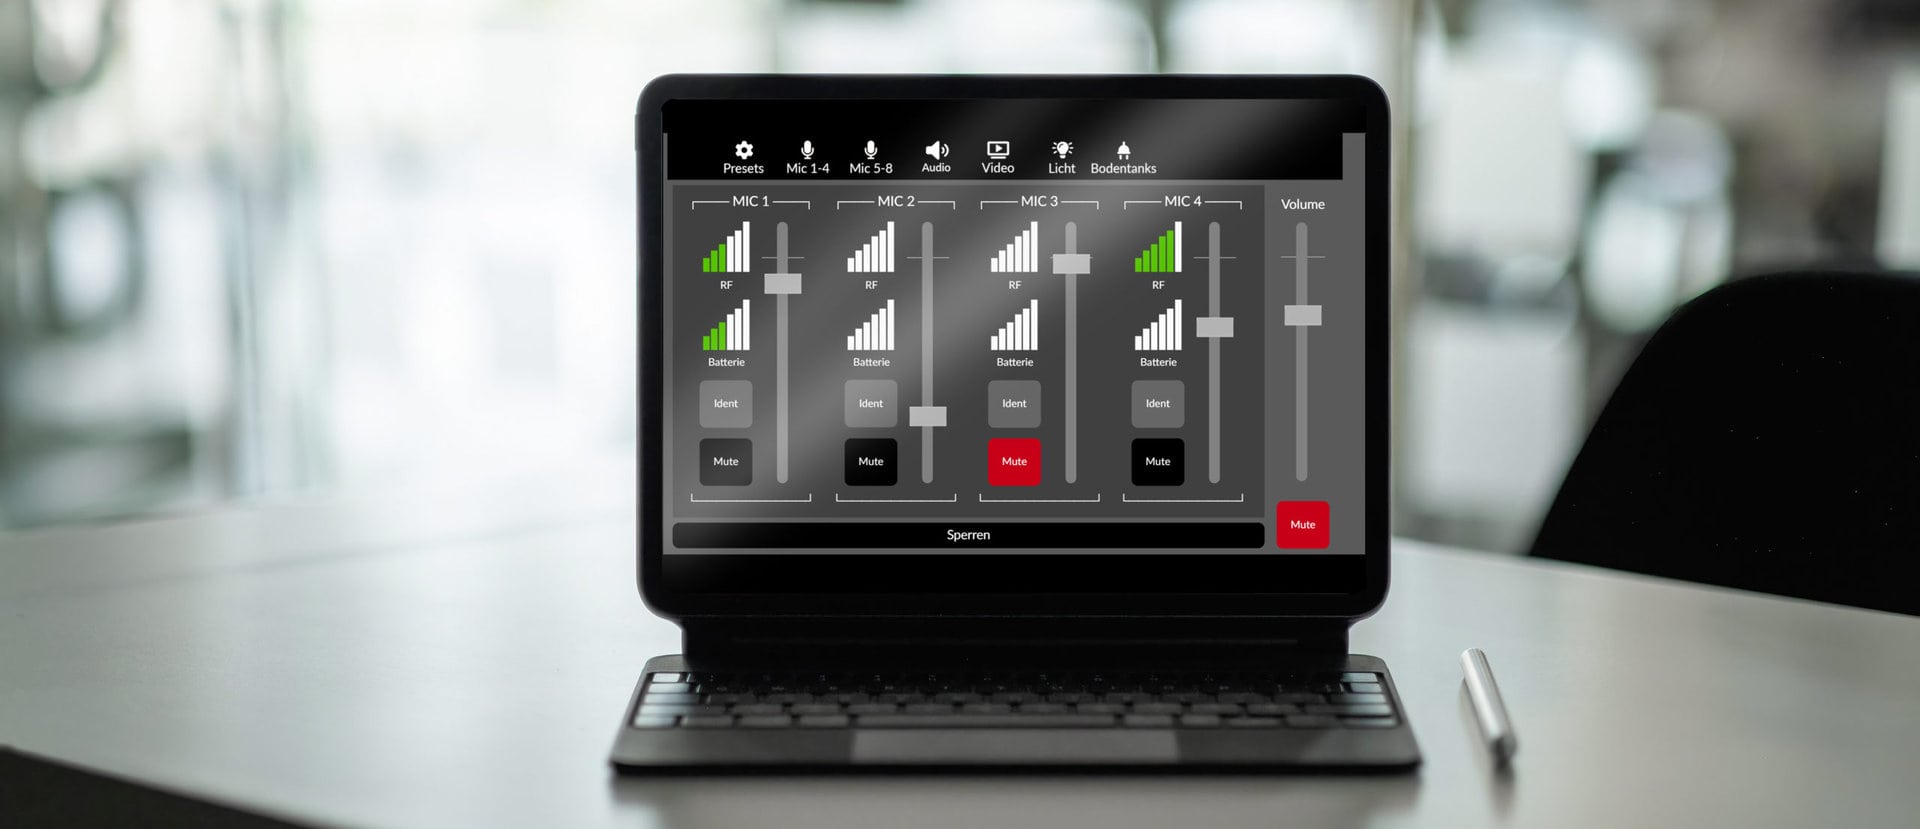
Control everything with one button click or have a separate button for everything?
You would like to use NeuroomNet dashboards in your projects as well?
Here are some examples of what these dashboards might look like:
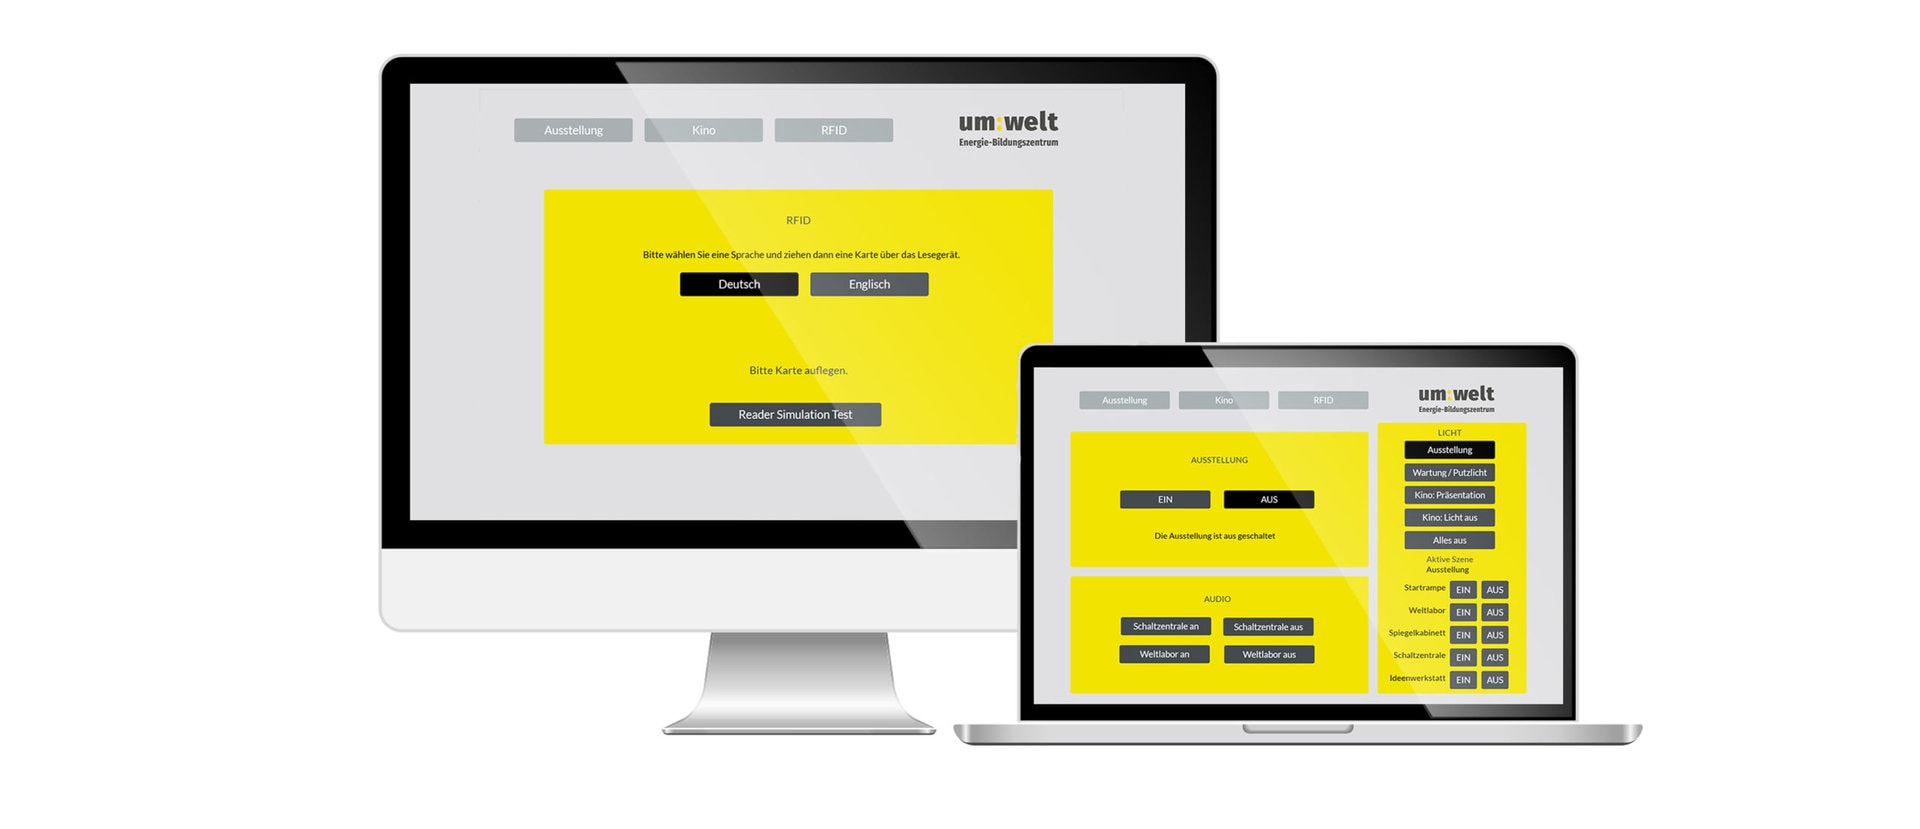
Dashboards can be loaded and operated via a browser on different end devices.

The colors and behavior of the buttons can be freely changed via CSS. The buttons are grouped into panels to facilitate changes in the arrangement.
Various sliders allow you to set volume and brightness values. The sliders can map both a linear and logarithmic value scale.
For more examples and explanations take a look at our documentation.